Last week I posted a poll on LinkedIn asking folks if they thought single family detached (SFD) land uses create an overall positive or negative impact on their city. Responses settled into a 50/50 split, with some insightful comments. Based on a few of the comments, I’ve decided to share my thoughts across a variety of “SFD: friend or foe?” posts. In this first post I’ll focus on the fiscal impacts of SFDs. In later posts I’ll look at affordable housing and equity issues.
So, financially, do SFDs cause more harm than good? Do they create an irreconcilable dead weight on the budget? No, they don’t. Most cities have enough money within their own economies to cover the shortfall of their own municipal budgets. Cities go bankrupt when shortfalls go unaddressed for so long that citizens cannot or will not cover the shortfall when it’s finally addressed. Cities have an ethical obligation to balance their long term budgets, not just their yearly budget. The most immediate fiscal danger I see threatening cities comes from a myopic yearly budgeting process that begins with allocating a projected revenue instead of working to fund long term obligations.
Single Family Detached: Friend or Foe to the Budget?
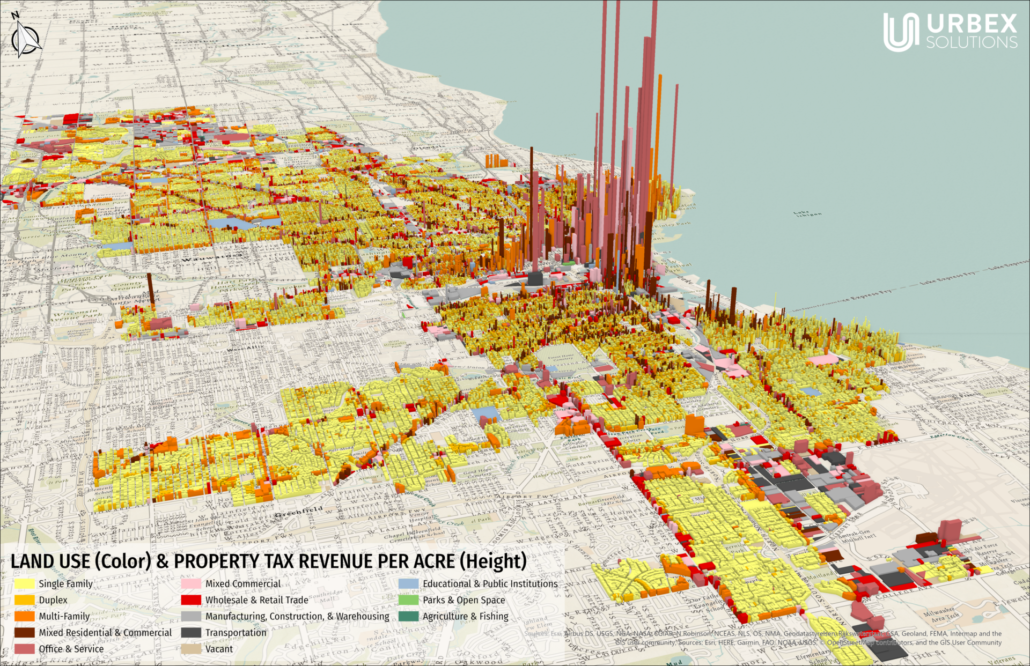
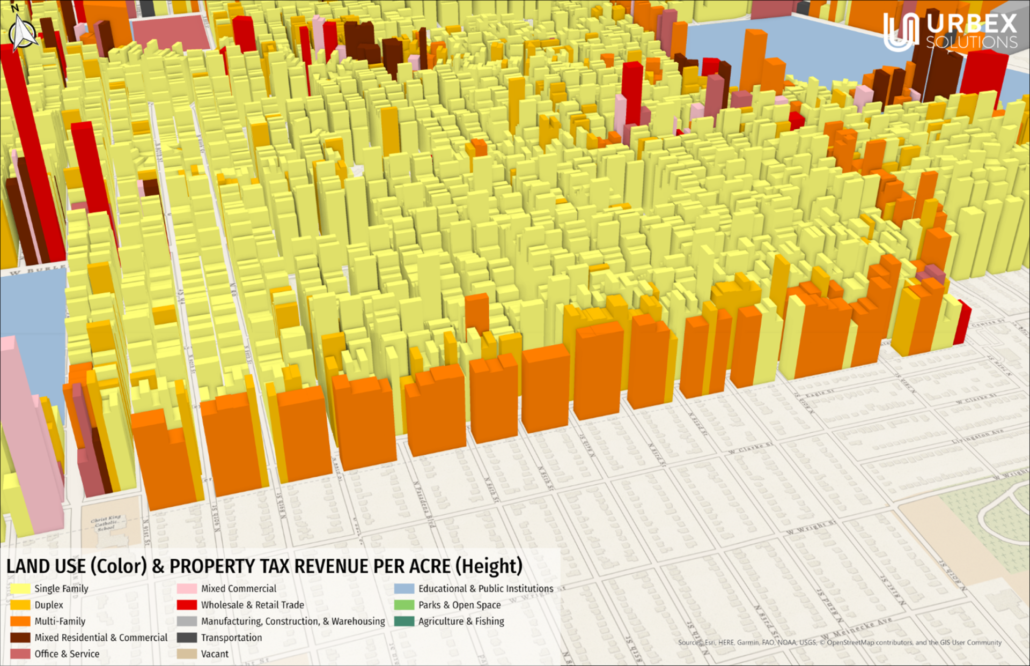
Do SFDs hurt or help a city’s budget? They can help tremendously. It depends on a host of variables. For illustrations I’ll use 2018 data from the City of Milwaukee. Below you’ll see a map that I used previously when discussing how categorical and geographical analysis both offer insight, though in different ways. The colors describe the land use of each parcel, with SFDs colored yellow. The height of the bars represent the revenue per acre generated by the parcel. Overall, you can see that downtown towers over most of the SFD (yellow) parcels. In the chart below the map we can also see the SFD (yellow) generates less revenue per acre overall than duplexes (orange), multi-family (dark-orange), mixed commercial & residential in (burgundy), and two of the other commercial uses (light red, pink).
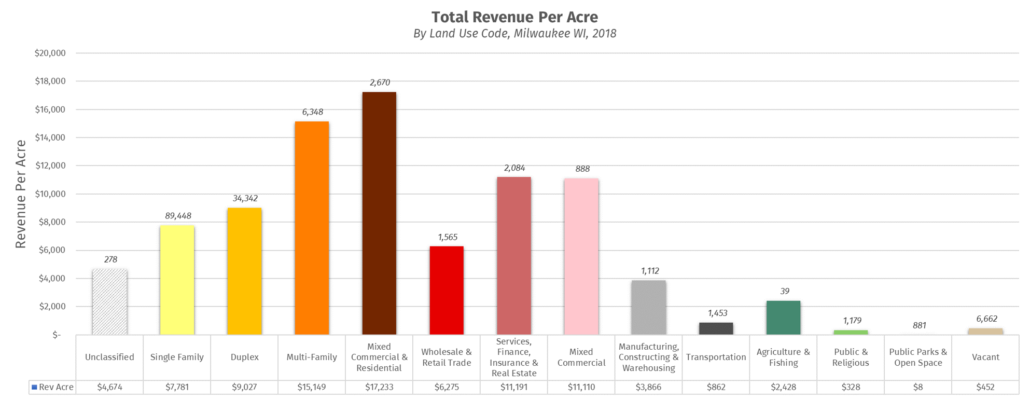
I have stated before that this kind of data should support multi-family and duplexes as a good residential land use. That’s still true. Typically, duplexes and multi-family housing offer a more affordable housing option and generally perform well fiscally for the city. However, that does not mean that SFDs cannot also provide affordable housing and perform well fiscally for the city. The chart above also shows that SFDs generate more revenue per acre than wholesale & retail trade (red), the industrial uses (grey, dark grey), vacant (tan), and the agricultural and open spaces (greens). SFDs as a group fall squarely in the middle of the pack. They are not the fiscal bottom dwellers they’re sometimes made out to be.
Not all ______s are the same, right? We should know better than to take that approach, right? While we can gain some insight from the broad groups in the bar chart above, it’s lazy and misleading to stop there. Take a look at the tables below. In the first you’ll see what percentage of each land use generates more revenue per acre than the indicated value at the top of each column. Again, SFDs outperform the industrial and vacant lots (bottom three lines). Some SFDs perform well. Not all mixed use, commercial, and multi-family uses perform well.

The next table illustrates how many parcels in each land use category generate less revenue per acre than the median revenue per acre of SFDs, which is $4,230 per acre. For clarity, this table says that the median SFD revenue per acre scores higher than 30% of the multi-family parcels, and 23% of the mixed commercial and residential parcels.

These two tables suggest that SFDs have a much smaller range of values. That means they lack the large outliers that inflate the averages of some of the other land uses we see in the first bar chart showing the average revenue per acre. Those outliers typically reside in tall urban structures, like downtown towers. Some land uses can work well in tall structures. However, SFDs typically don’t get taller than 2 or 3 stories.
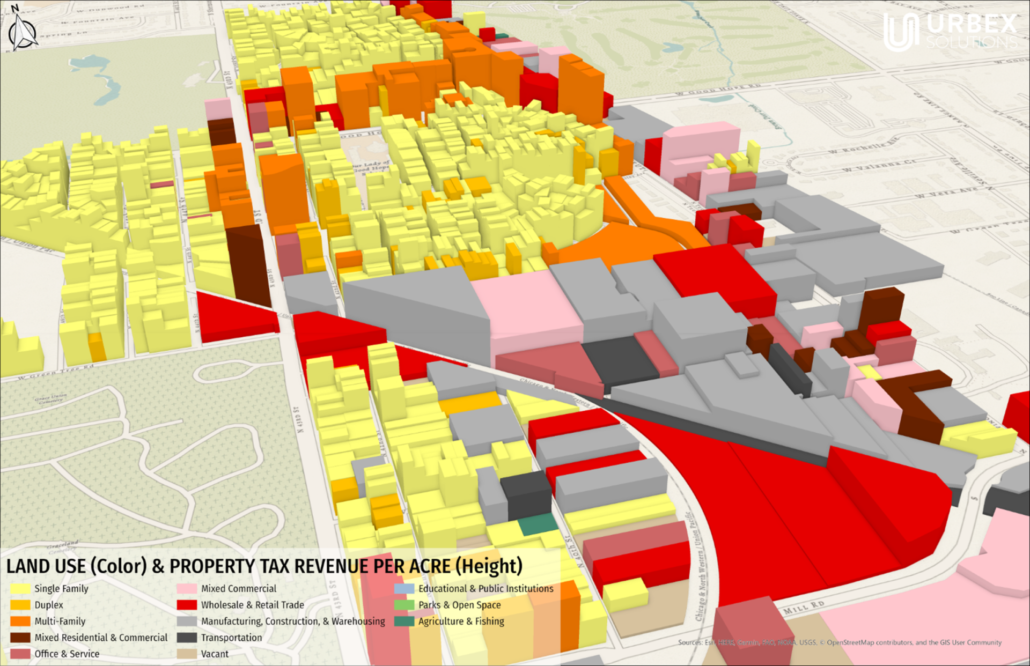
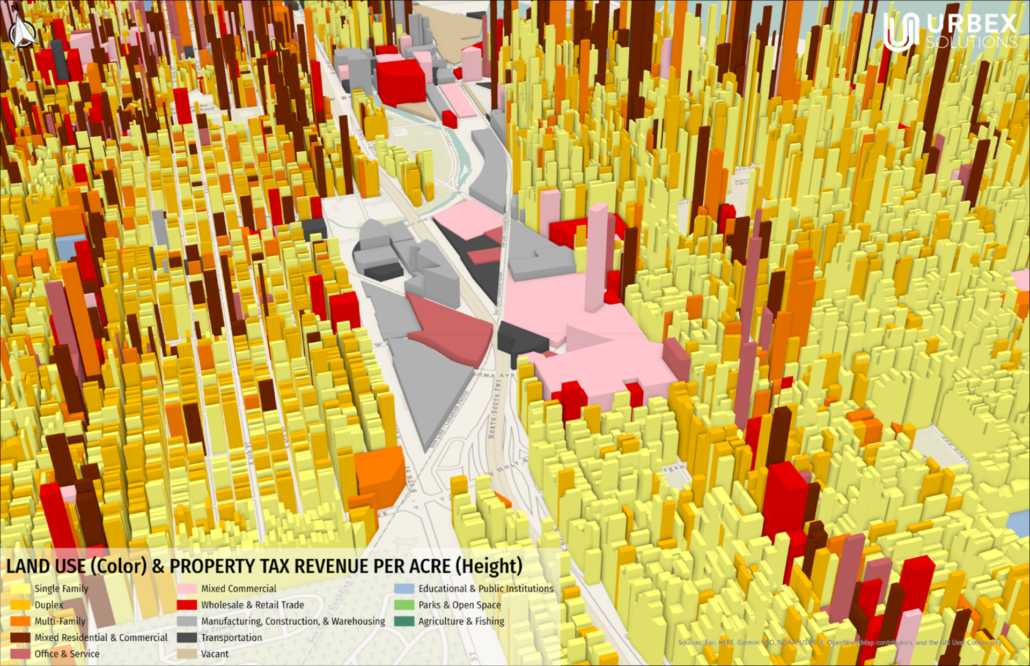
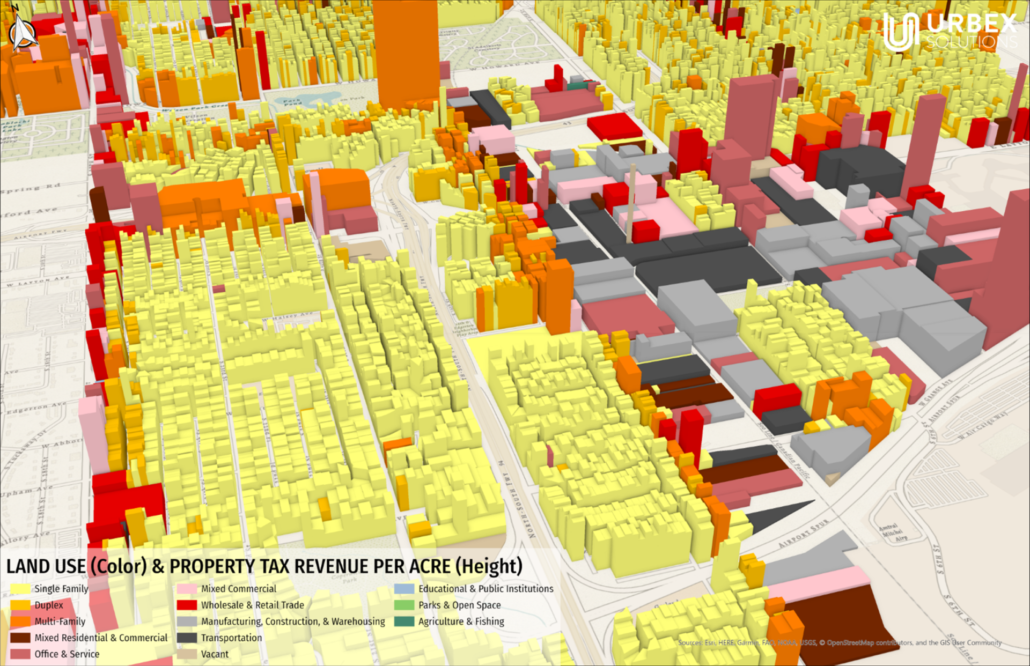
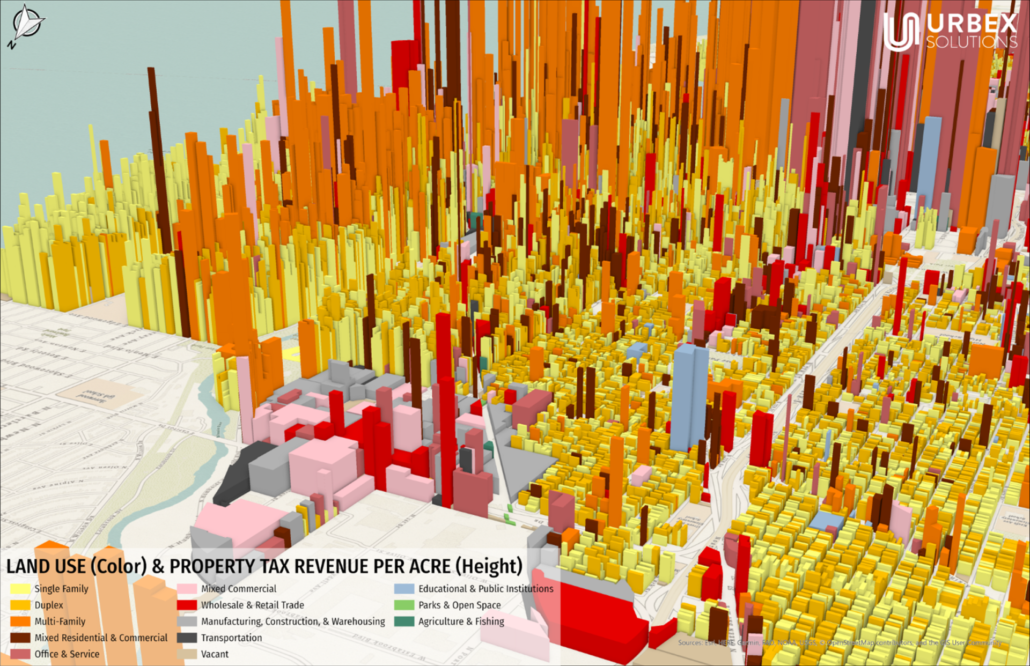
We can zoom in on the map and observe this principle on the ground. The following maps show close up shots of neighborhoods around Milwaukee with an SFD presence. Notice the variety in heights (revenue per acre) within the SFDs (yellow). Also, notice that many of the SFDs have similar or taller heights than some of the other land uses shown in different colors.
Analogies:
I love analogies, so let me offer you two. It may help to think of SFDs like an ingredient in a recipe, say, salt. Does salt always make food better? Depends on who you ask, how much you use, the type of food, and dietary constraints. I typically put more salt on my eggs, want less in my salsa, and none in my ice tea. That may not work for everybody though. People have different tastes and dietary needs.
We might also think of SFDs as an animal in an ecosystem. In the early 1900’s we eradicated wolves from Yellowstone. Generally, we viewed them as more dangerous and costly than other predators. A total nuisance. However, removing them created a set of all new unintended problems. When scientists reintroduced them to Yellowstone, they began to see a wide range of benefits. Before we take any drastic steps to remove SFDs (or any landuse), we need to make sure we understand how they impact the rest of the system.
Friend of Foe?
So, friend of foe to the budget? I say friend. The data shows that SFDs can perform well, even better than some other uses we typically assume do better, like industrial. Do they always perform better than other land uses? No, but none of the other land uses always perform better than SFDs either. A city struggling financially will likely need quick solutions. Building a downtown is not quick or cheap. Outlawing all new SFDs might not change anything, especially if the tax rate drops. In a crisis, changing the tax rate, adjusting fee structures, and cutting costs all provide quicker and potentially more powerful solutions.
In the long run cities still need to understand the powerful impact their development patterns, including SFDs, have on their budget. They also need to understand their long term budget obligations clearly before discussing their fee structures and tax rates. SFDs can easily fit in the development portfolio of a fiscally sustainable city.