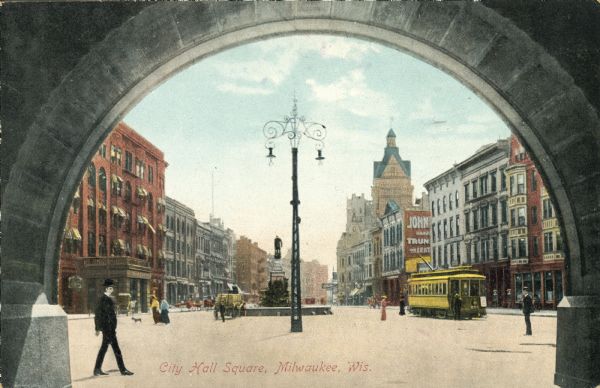
Banner Image: Wisconsin Historical Society, Image 123635
If you work in any form of city planning you’ve probably seen at least one slick 3D map illustrating some kind of value metric. Often times these maps have an agenda. Rarely do they come from an altruistic curiosity. In my experience I’ve seen two primary agendas. Most often I’ve seen these maps and studies from urbanists and urban developers who want to push developing more urban development patterns. Value per acre in downtowns, even old downtowns, dwarf surrounding suburban development. True enough. The second most common agenda I’ve seen comes from the more suburban end of the development community. They’ll show overall value per lot and then calculate total projected revenue for the city if their development gets approved. It might be a commercial center, industrial park, or single family neighborhood.
These studies typically have an outcome in mind before they begin, and that includes selling an idea to a city or investor. That doesn’t always negate the results, but in my experience working for cities I had a hard time trusting a model that had a self interested outcome in mind from the beginning. A developer should craft their model to best suit their needs; it’s important for everyone that the development community stay in business. However, it left me searching for a model with the city’s long term financial health as its beginning and end.
Here I’m going to share some thoughts on how a city might begin to utilize data analysis to practice better financial stewardship and government transparency. I hope that every city can learn to do this, and if you’re city needs help, please let me know. It’s what I’m passionate about working on. To keep things short, I will focus on how a city should define value, and why it matters.
HOW SHOULD WE DEFINE VALUE?
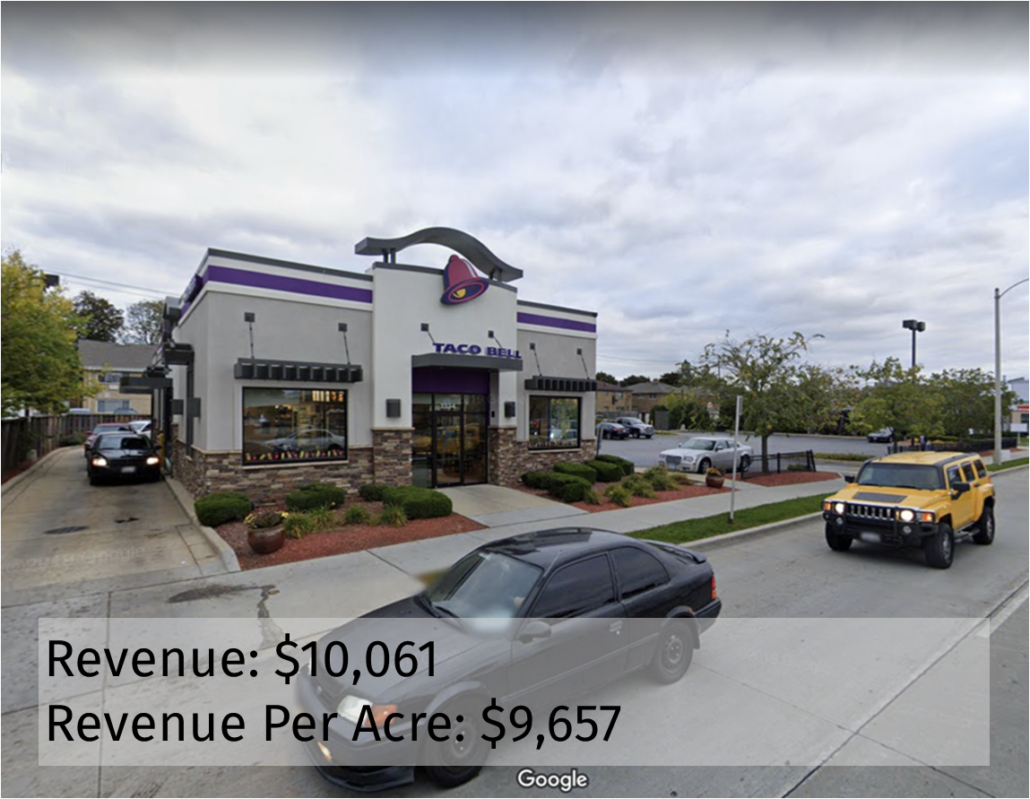
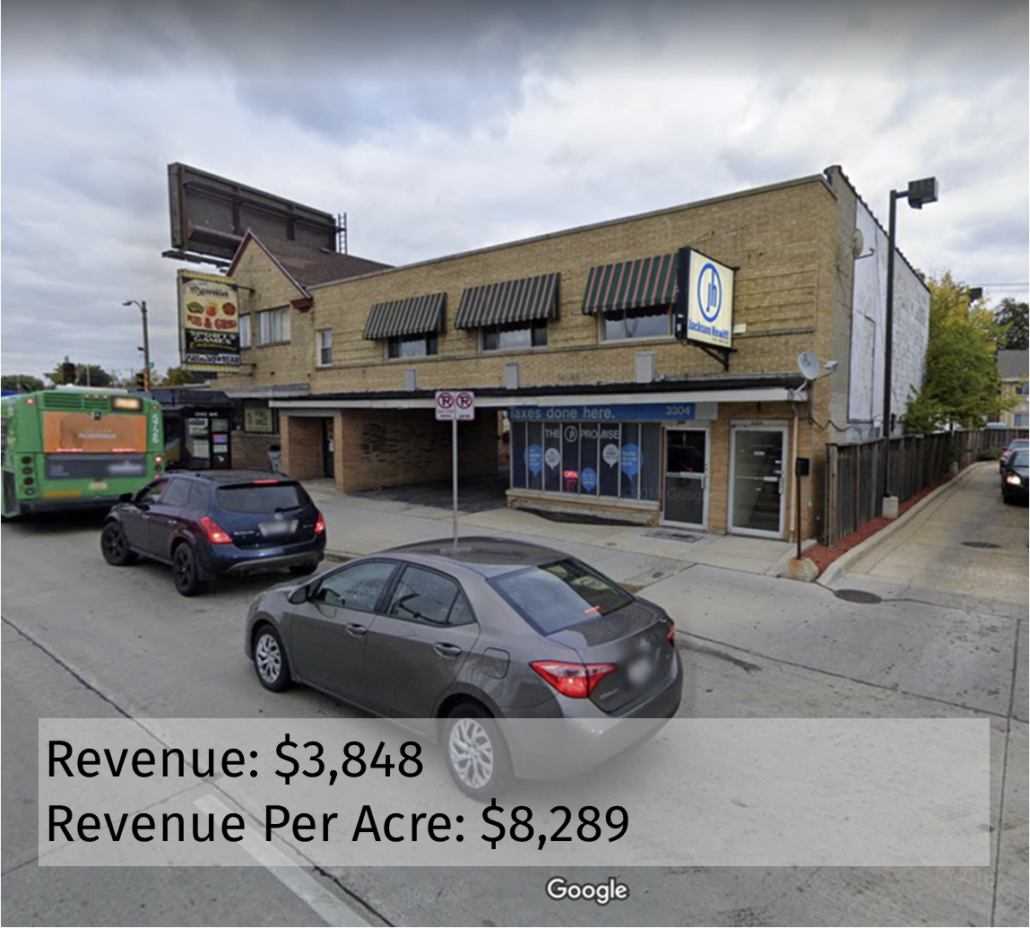
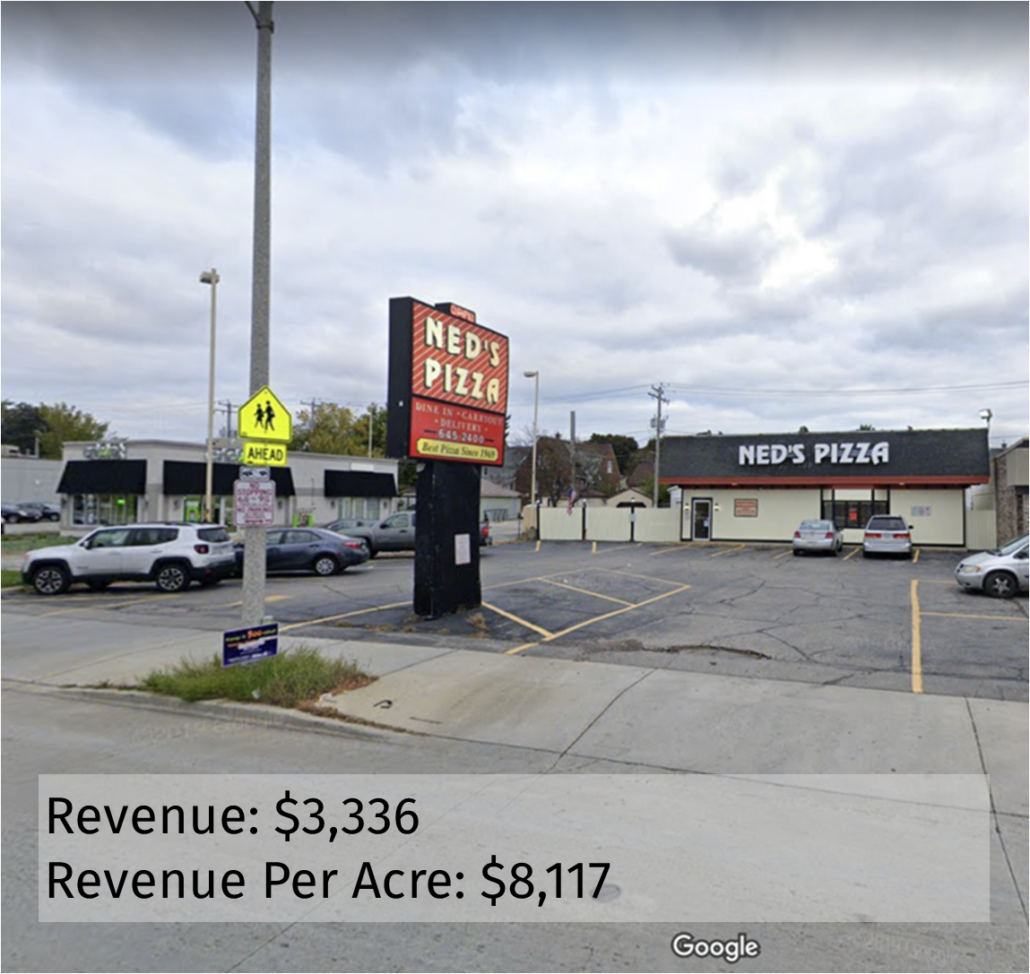
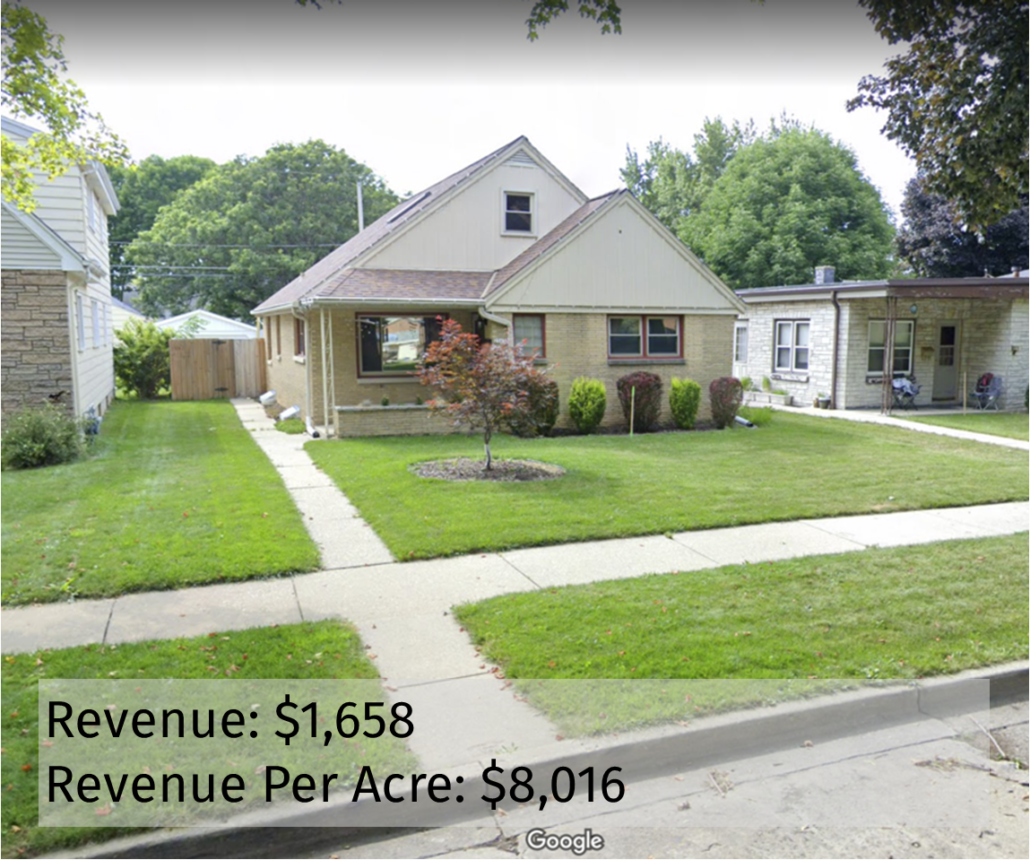
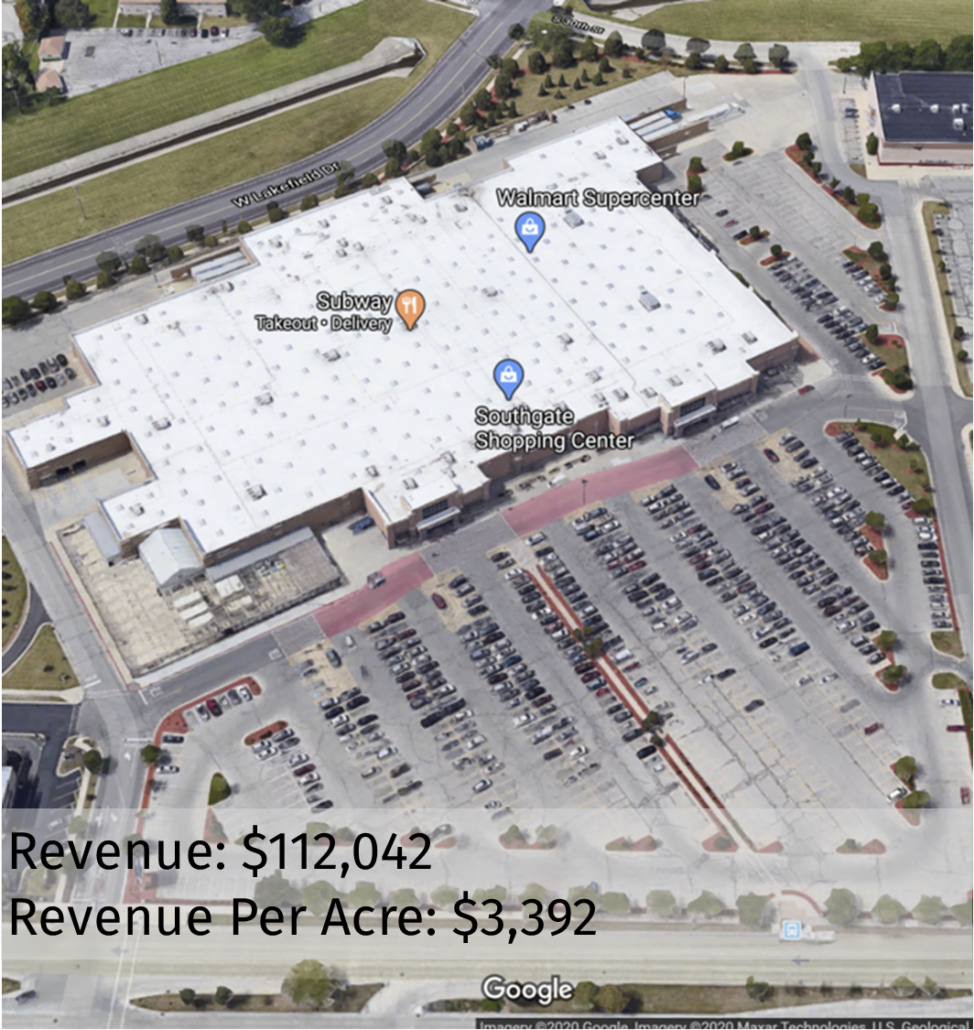
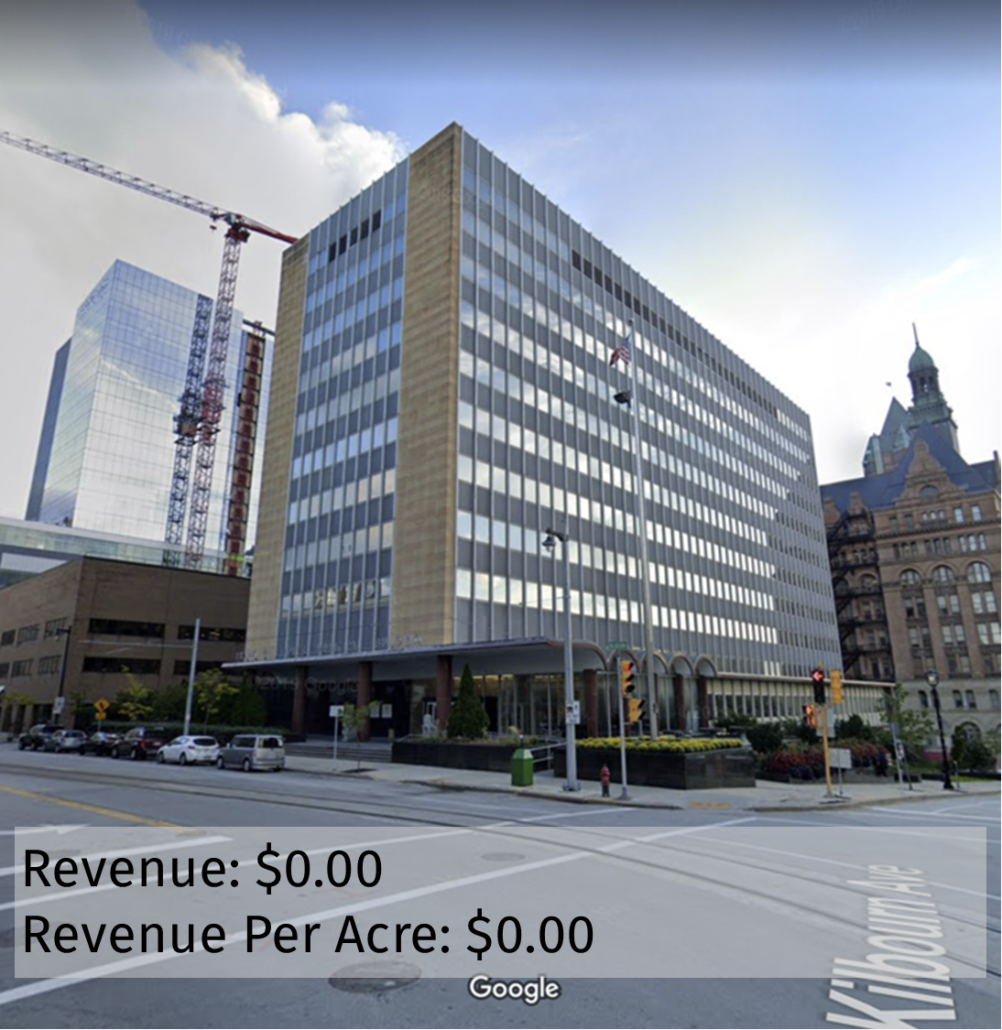
How we define value has long lasting impacts on the way we approach financial stewardship. For a city, subtle changes in value definition can lead to dramatically different outcomes. I’ve arranged the properties below by total appraised value, which is also shown as the upper value in each photo. Notice, if we arranged them by appraised value per acre (lower value), then the big box store currently in the second spot moves to the end while all the others move up but stay in order.
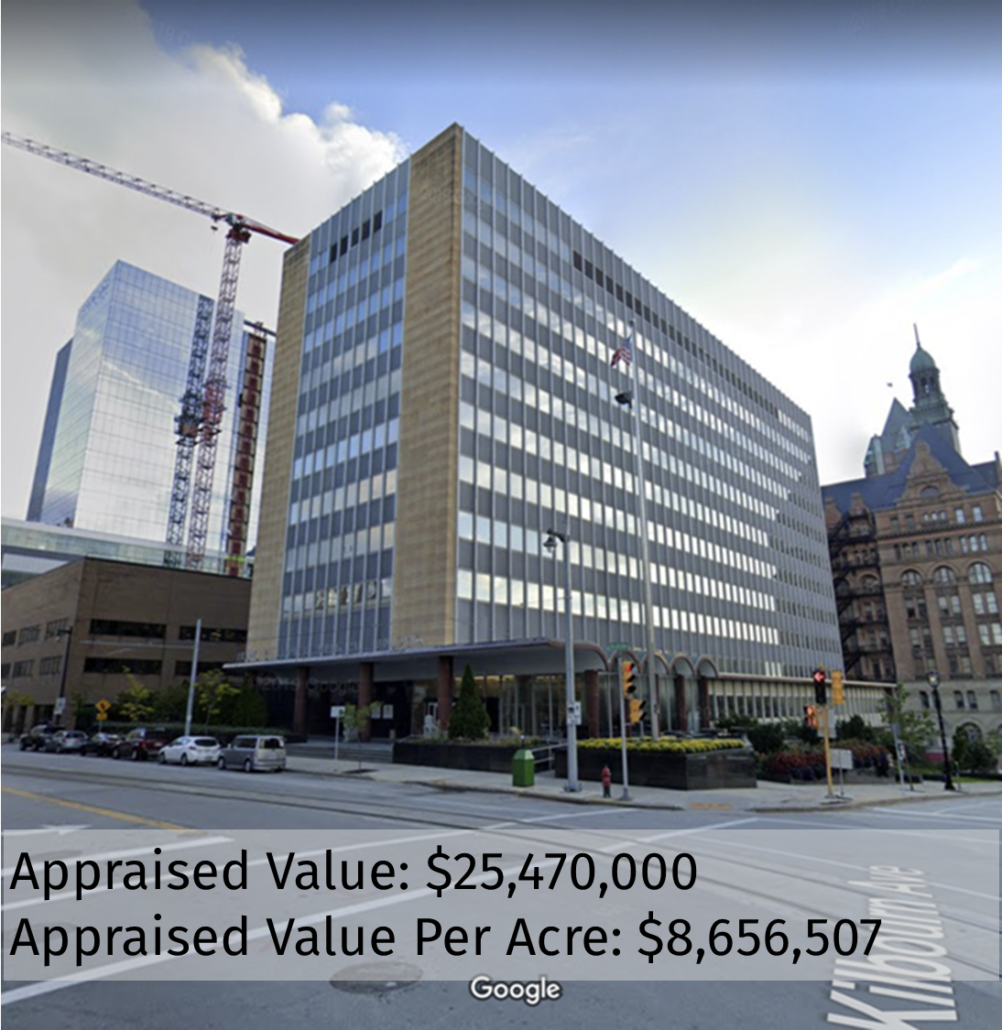
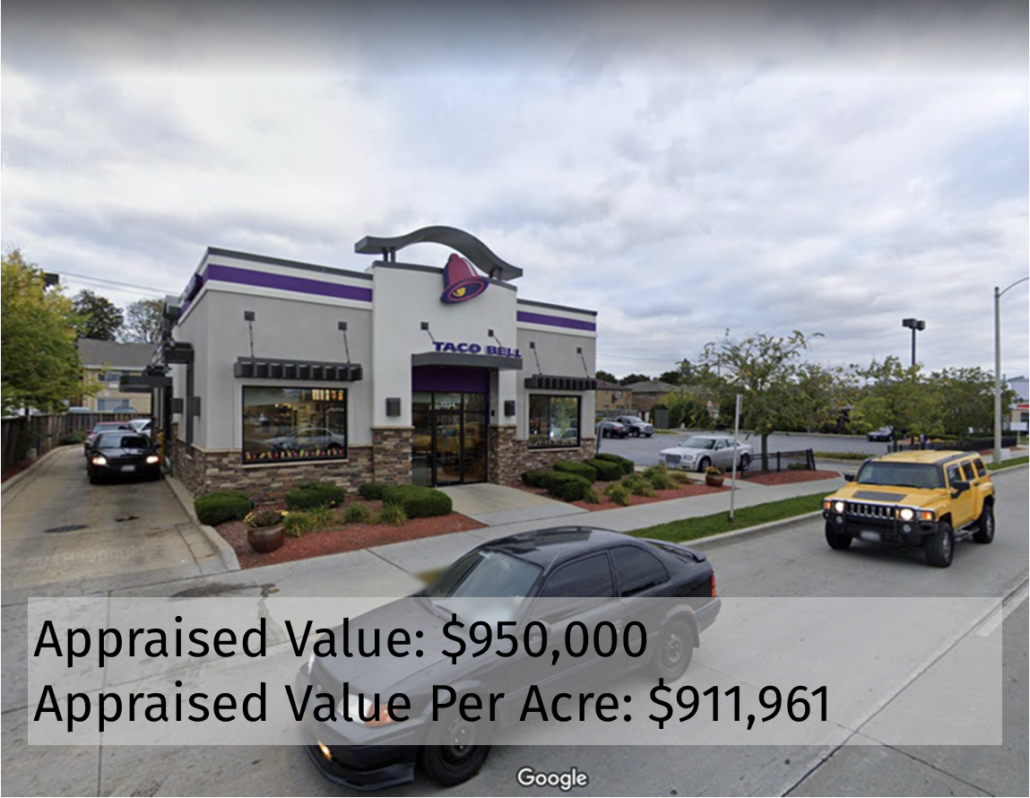
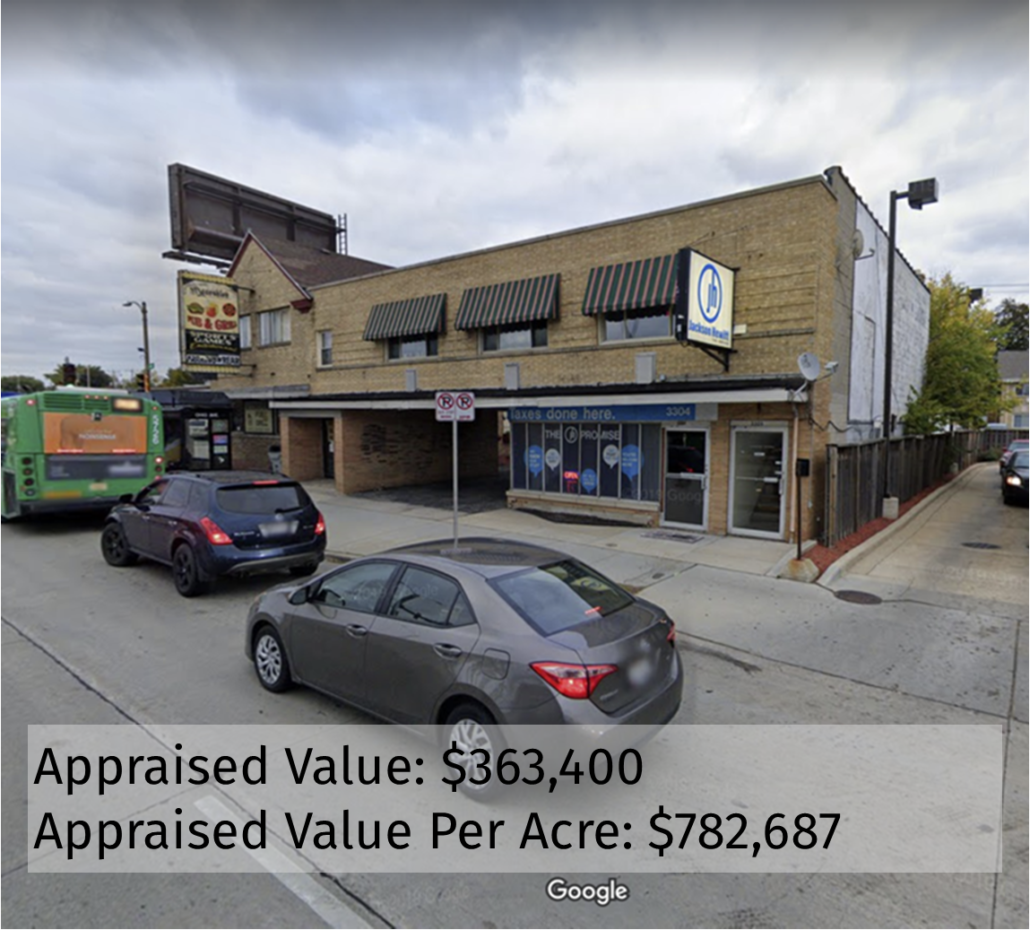
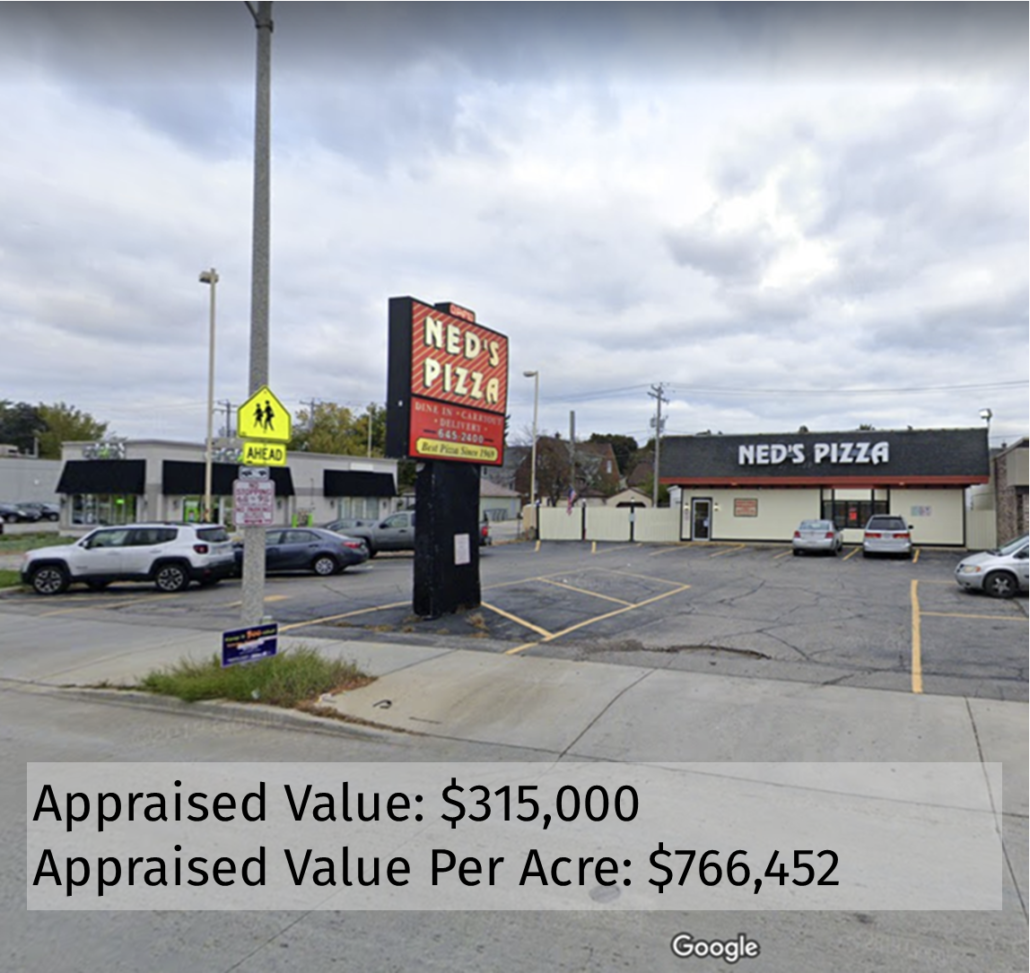
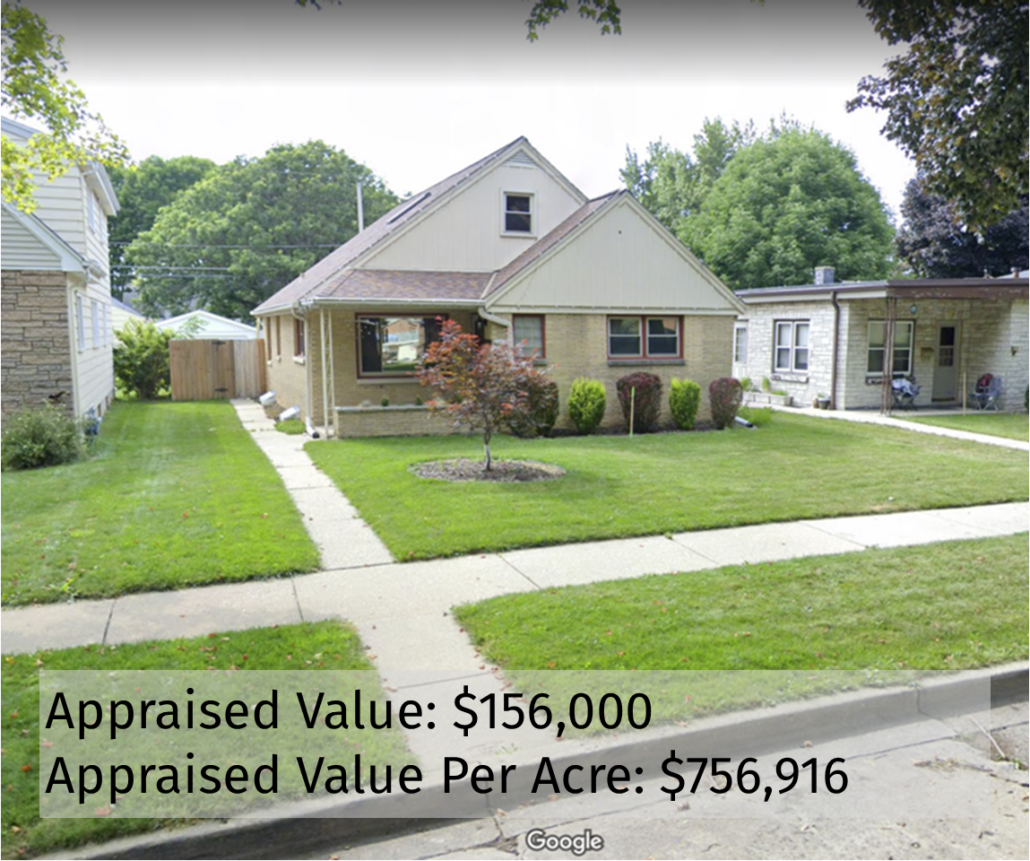
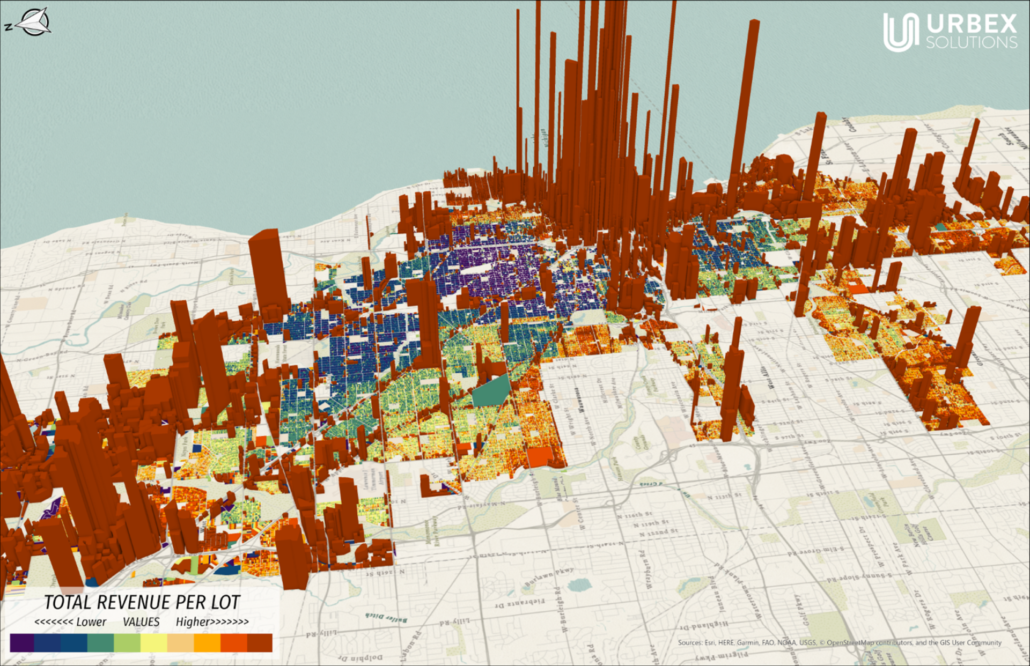
I think this ordering reflects how many people would intuitively rank these properties in order of value if asked to. This method of value also explains why many cities, especially in Texas, have begun aggressively zoning for expensive large lot homes, commercial, and industrial uses. The order and scale of differences change when we look at the appraised value per acre. The big box store moves to the end, while the single family detached home scores very close to the small commercial parcels. Mapping the total appraised value and the appraised value per acre across across the entire city shows a similar shift, as shown in the next two maps.
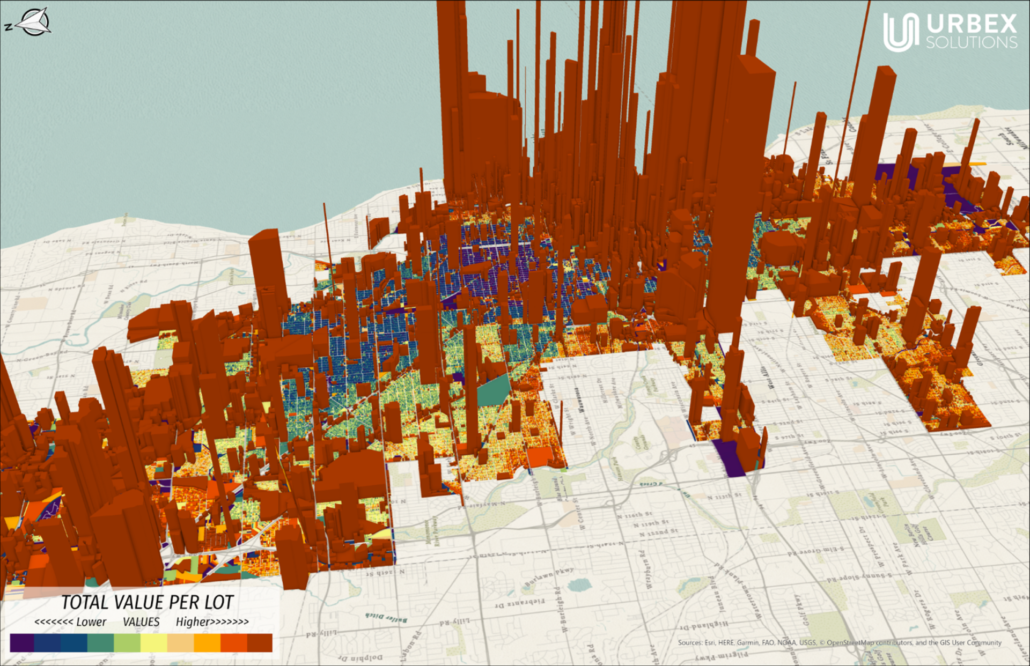
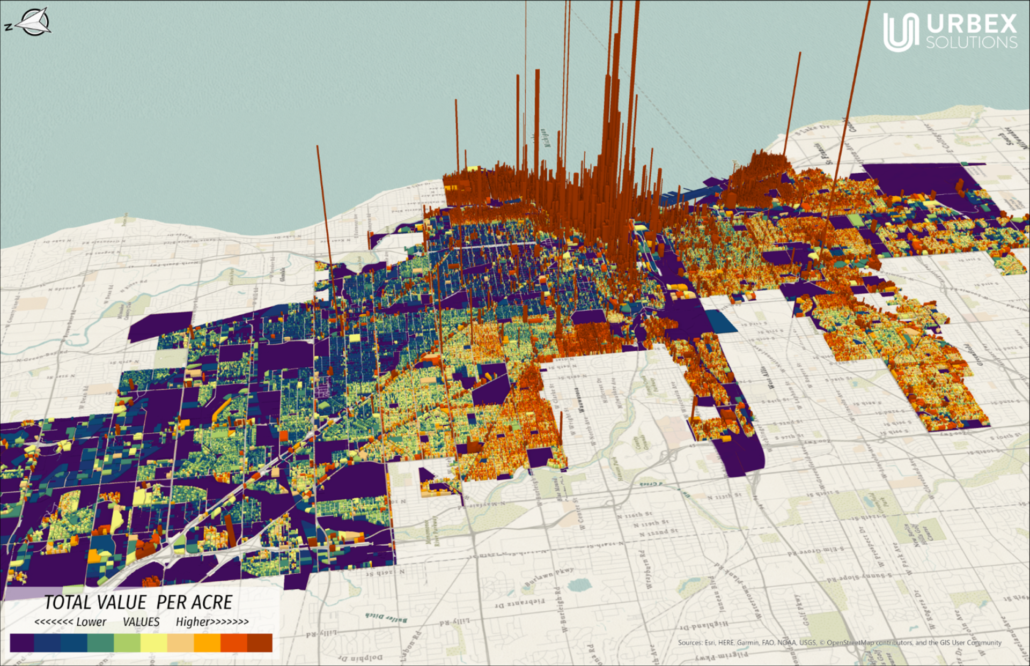
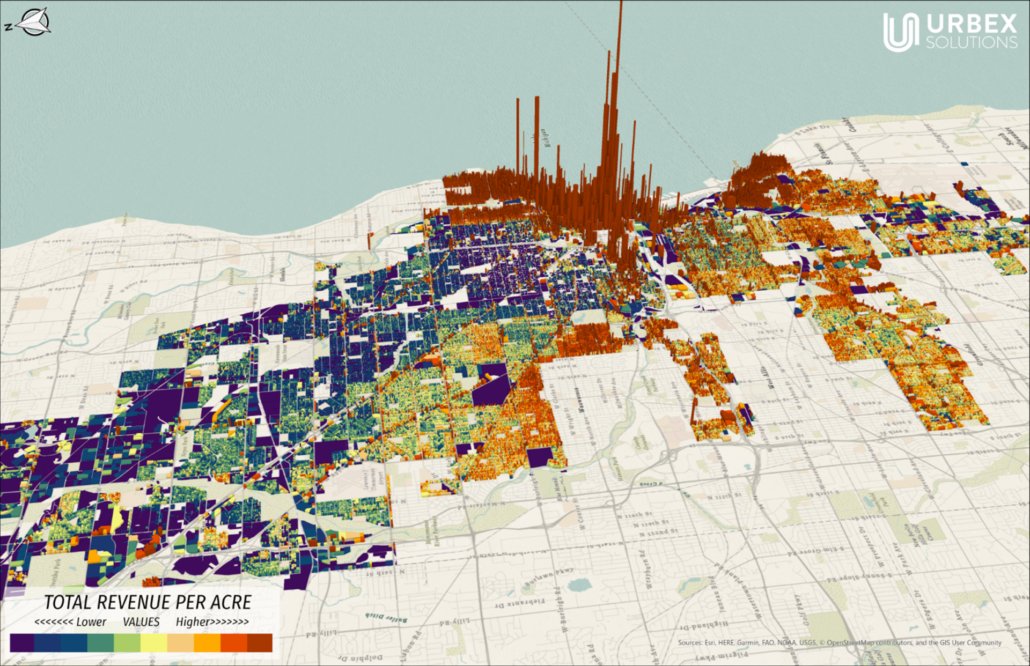
Downtown does well with either metric, but a big shift occurs outside of downtown. As much as these maps differ, they still don’t tell us about the revenue the city collects through property taxes. If we look at the same group of pictures with revenue per acre metrics, the story changes again (as shown below). The City of Milwaukee owns that high value downtown building, so it doesn’t generate any property tax revenues. Many properties throughout the city of Milwaukee have full tax exemptions which means they don’t pay any property taxes. Organizations such as the city, county, churches, the school district, public libraries, the fire department, and many other public facilities have total tax exemptions. I’m not suggesting that any of these institutions should pay property taxes, I’m only stating that it’s important to remove them from a fiscal analysis study.
The maps below illustrate the differences between appraised value and revenue metrics. On the left you’ll see the appraised value per lot (top left) and appraised value per acre (bottom left) maps from earlier. The two maps on the right show the revenue per lot (top) and the revenue per acre (bottom). First notice that the maps on the right showing revenue have quite a few missing properties compared to the maps on the left. Those represent tax exempt properties. Moving from top to bottom we can see the difference we noticed earlier between total appraised value per lot and appraised value per acre also occur between total revenue per lot and revenue per acre.

WHY DOES IT MATTER?
It’s important to sue revenue metrics instead of value metrics for a variety of reasons, but I’ll briefly touch on two. First of all, it allows a city to establish a strong foundation for developing deeper fiscal analysis tools. For example, a city may want to allocate cost burdens to parcels in order to calculate return on investment (ROI) or net revenue per acre (NRA) metrics. Once costs get allocated the appraised value metrics become useless since cities use revenues to pay for costs, not values. Furthermore, it’s important to allocate costs to only revenue generating parcels so that all the costs in a city’s budget get accounted for. Any cost allocated to a tax exempt property can only ever remain a total loss. That’s useless for budget analysis. Worse still, it makes the revenue generating properties appear to have a stronger ROI than they actually do, since the city budget needs those properties to cover the costs of serving tax exempt properties as well as their own. The difference might look small in exercise, but it can mean the difference between a large amount of parcels registering as net positives or net negatives.
The key take away: cities need to use revenue for fiscal analysis, not appraised value. Revenue per acre and total revenue per lot can both present useful data, but the key remains to study revenue. I’ll continue to dive deeper into the Milwaukee data set. Next I’ll look at the difference between categorical analysis like land uses and geographical analysis like neighborhoods. If you have anything you’d like me to look at, please reach out. If you live in or work for the City of Milwaukee and would like access to the data set or request a specific type of analysis, please let me know.